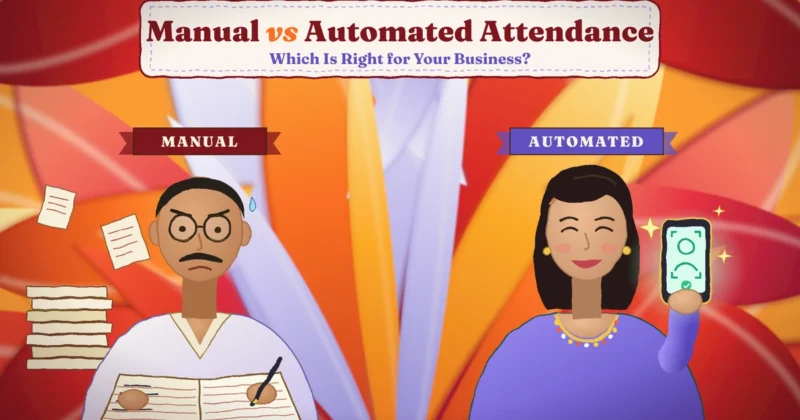
Every month, the same scene plays out in thousands of Indian offices.
It’s the 30th. The owner wants salaries ready by the 1st. HR opens the attendance register and finds a mess: a few pages with coffee stains, names signed in three different pens, a leave form that was “submitted on WhatsApp,” and one employee who swears he came in on the 14th even though the register says otherwise.
Two days later, salaries go out. Three people complain. Nobody is fully sure who is right.
It doesn’t have to be like this. A proper attendance report turns that month-end chaos into a ten-minute job. And you don’t need expensive software to start. A simple spreadsheet and a few rules are enough.
In this guide, we’ll build a real attendance report together, step by step, using an example employee. By the end, you’ll know exactly what goes into a report, how to build one without getting lost in numbers, and when it’s time to let software do the work for you.
Short answer: To create an attendance report, fix your attendance rules first, then record each employee’s daily status with simple codes such as P for present and A for absent. Count present days, half days, leave, holidays, weekly offs, late marks and overtime for each person, then work out payable days and attendance percentage. You can do this in Excel or Google Sheets with a few formulas, or use attendance software to create it automatically.
First, What Exactly Is an Attendance Report?
An attendance report is a summary of who worked, when, and for how long over a set period.
Your raw attendance data is just a long list of punches: Ramesh in at 9:32, out at 6:41. Priya is at 9:58. Ajay is absent. The report takes all those punches and answers the questions that actually matter:
- How many days did each person work this month?
- How many times were they late?
- How much leave did they take, and was it paid?
- How many extra hours did they put in?
- How many days should we pay them for?
In India, the monthly version is often called a muster roll. It’s also the record you’ll need if a labor inspector or auditor ever asks how many hours your people worked.
Before vs. Now: Attendance Reports Then and Today
Here’s how creating an attendance report changes when a business moves from a register to a proper system.
| What you look at | Before (register and manual counting) | Now (organised sheet or attendance software) |
|---|---|---|
| Daily attendance | Signatures in a register, often missing | Clear status for every person, every day |
| Counting days | Counted by hand at month end | Totals worked out automatically. |
| Late arrivals | Rarely noticed or recorded | Marked and counted for each person |
| Leave | Paper slips and WhatsApp messages | Recorded in the same report |
| Holidays and Sundays | Sometimes marked as absent by mistake | Marked separately, never counted as absence |
| Time to prepare | Two to three days | A few minutes |
| Mistakes | Common, found only after salaries go out | Rare, caught by simple checks |
| Salary disputes | Hard to settle | Settled quickly with clear records |
| Spotting patterns | Almost impossible | Easy to see who is often late or absent |
| Audits and inspections | Searching through old registers | Report ready to download anytime |
The biggest difference isn’t the time saved. It’s that everyone, from the owner to the employee, can trust the report.
The One Thing to Do Before You Open Excel

Most attendance reports go wrong before anyone types a single number. They go wrong because nobody agreed on the rules.
Is 9:41 late, or is there a grace period? Does leaving at 3 pm count as a half day? Do three late marks cost anything? If these answers live only in a manager’s head, every report becomes an argument.
So, before anything else, write down these rules on one page:
- Shift time: for example, 9:30 am to 6:30 pm
- Grace time: for example, 10 minutes, so 9:40 am is still on time
- Late-mark penalty: for example, every 3 late marks in a month cut half a day’s pay
- Half-day rule: for example, fewer than 4.5 hours worked counts as a half day
- Weekly off: for example, every Sunday
- Holidays: your company’s holiday list for the year
- Leave: which leave is paid (casual, sick, or earned) and which is unpaid
- Overtime: for example, any time beyond 9 hours in a day
Share this page with your team. Now, when someone asks why they were marked late, the answer is on paper, not in someone’s mood. You can find more help on setting fair leave rules in our guides on leave and holiday management.
Meet Ramesh: Our Example for This Guide
To make this practical, let’s follow one employee through a full month.
Ramesh works in accounts at a small trading company in Surat. The month is October 2026. Apart from Sundays and the Gandhi Jayanti holiday on the 2nd, he was expected at work every day.
Here’s what his month looked like:
- Most days, he came in on time
- A few days later, he came in late
- He took a half day for a family function
- He took one day of paid casual leave
- He was absent once without telling anyone
Nothing unusual. This is what most employees’ months look like. But turning even this simple month into a clear, fair report is where many businesses struggle.
Now let’s build his report.
Building the Report in Excel or Google Sheets
You can follow these steps in Excel or Google Sheets. You don’t need to be good at math or formulas. The sheet does most of the work once it’s set up.
Step 1: Lay Out the Sheet
At the top, add your company name, the report title and the month, for example, “Monthly Attendance Report, October 2026.”
Below that, add one employee per row. Use the first few columns for basic details: Employee ID, Name, Department, and Shift.
Next to these, add one column for each date of the month, from 1 to 31. Write the day of the week above each date, so Sundays and holidays are easy to spot.
At the end of the row, keep a few columns for the monthly totals: present days, half days, absences, leave, weekly offs, holidays, and late marks.
Step 2: Fill in Each Day with a Simple Code
Instead of writing “Present” or “Absent” in full, use short codes. They’re faster to type, easier to read, and simple for the sheet to count.
- P = Present, on time
- LT = Present, but late
- HD = Half day
- L = Paid leave
- LOP = Unpaid leave (loss of pay)
- A = Absent without leave
- WO = Weekly off
- H = Holiday
For Ramesh, the 2nd gets H, every Sunday gets WO, and every other day gets P, LT, HD, L or A based on what actually happened.
Pro tip: people mistype. Someone will write “p” or “Pres,” and the totals will go wrong. To stop this, give every cell a dropdown list with only these codes. In Excel, use Data Validation. In Google Sheets, use Data Validation and choose Dropdown. Now nobody can type anything else.
Step 3: Let the Sheet Count the Totals
You don’t have to count each person’s days by hand. One simple formula, COUNTIF, counts how many times a code appears in a row. For example, this counts the “P” days for the first employee:
=COUNTIF(E2:AI2,"P")
Here, E2 to AI2 are the date columns for that employee. Change “P” to “A,” “L,” “HD,” or any other code to count that instead, then drag the formula down for everyone else.
For Ramesh, the sheet shows his days present (including his late days), his half day, his paid leave, his one absence, his Sundays, and the holiday, all counted for you.
Step 4: Work Out Payable Days
Payable days are the days you pay salary for. Most companies count:
- days present
- paid leave
- weekly offs
- paid holidays
- half days as half a day each
Absences and unpaid leave are not paid. If your company has a late-mark rule, such as every 3 late marks cutting half a day, that is taken off too.
For Ramesh, this means he is paid for almost the whole month. His one unplanned absence, and his late marks if your rule cuts pay for them, are the only reasons he isn’t paid for every day, and both follow rules everyone already knows.
You can add a payable days column that adds these totals up for you, so the number updates on its own whenever attendance changes. Once payable days are clear, salary is simply calculated from them, based on your company’s salary policy. You can read more about this in our guides on payroll and working hours.
Step 5: Add Attendance Percentage
Attendance percentage shows how regularly someone came in on days they were supposed to work. It ignores Sundays and holidays, because nobody is expected to come in on those days.
Ramesh came in on almost every working day, so his attendance is around 90%, which most companies would see as good. Most attendance tools and spreadsheets can show this for every employee in one column.
Step 6: Make Problems Jump Off the Page
A sheet full of letters is hard to read. Use Conditional Formatting to add color:
- A in red, so absences are obvious
- LT in orange, so late patterns show up
- L and LOP in yellow
- WO and H in light grey
- Attendance below 90% highlighted in the summary
Now when the owner glances at the sheet, they can see in two seconds that one person is late every Monday or that one team has a lot of red.
Step 7: Check Before You Send
Before you share the report, run three quick checks:
- The days add up. For every employee, all the codes together should equal the days in the month. If a row adds up to 30 in a 31-day month, a day is missing.
- Leave matches approvals. Every “L” should have an approved leave request behind it.
- A few rows look right. Pick two or three employees and check their totals against what you know about their month.
Then lock the total columns so nobody changes them by accident, and save a PDF copy for your records.
What a Good Attendance Report Looks Like

Whether you use a spreadsheet or software, a good attendance report has a few things in common:
- It’s easy to read in one glance. Names on the left, days across the top, totals at the end, with colors for problems.
- It uses the same codes and rules every month. Nobody has to guess what a symbol means.
- It has no blank days. Every working day for every person has a status.
- It shows the “why” where needed. A short remarks column for things like “joined on 15th” or “on maternity leave” saves questions later.
- It has one final version. Everyone works from the same file, not five copies on email.
- It’s ready on time. A report that arrives after salaries are paid helps nobody.
Different Reports for Different People
The monthly report is the big one, but different people need different views of the same data.
- The daily report is for managers each morning. Who’s in, who’s late, who’s on leave today.
- The late arrival report lists people who came in late, how often and by how much. Great for gentle conversations before habits form.
- The overtime report shows who is working extra hours. Regular high overtime often means a team is short-staffed.
- The leave report shows leave taken and balances left, so nobody goes over their limit by surprise.
- The absenteeism report highlights unplanned absences and patterns, such as the classic Monday absence.
- The branch or team report compares attendance across locations, so you can see where problems sit.
Reading Between the Lines
A good attendance report doesn’t just tell you who was absent. It tells you a story about your team, if you look closely.
A sudden drop. An employee with near-perfect attendance suddenly has five absences. That’s rarely laziness. It’s often a health issue, a family problem or a sign they’re unhappy and looking elsewhere. A quiet chat helps more than a salary cut.
The Monday pattern. If absences cluster on Mondays or after holidays, it may be worth looking at workload or team morale.
The overtime trap. If the same three people always have overtime, they’re either carrying the team or the team is understaffed. Both lead to burnout.
One team stands out. If one department has far more late marks than others, look at the manager, the shift timing or even the bus routes before blaming the people.
Recognise the good. People with steady, reliable attendance rarely get noticed. A simple thank-you goes a long way.
For more ideas on turning attendance data into a happier, more productive team, explore our guides on employee productivity.
When Excel Stops Being Enough
The spreadsheet method works well for a small team. But there’s a point where it starts costing more time than it saves. You’ll know you’ve reached it when:
- Typing codes for every person every day takes more than a few minutes
- Different people keep different versions of the sheet, and nobody knows which one is final
- Someone changes a cell, and there’s no record of who did it or why
- You have staff in two or more locations, or some working from home
- You run shifts, night work or a lot of overtime
- A formula breaks every time someone adds a new employee
As a rough guide, once you cross 15 to 20 people, attendance software usually pays for itself in saved time alone.
How Attendance Software Creates Reports for You
With software, you skip almost every manual step above.
- Employees punch in and out using a biometric device, a QR code or a mobile app. Every punch has an exact time stamp.
- You set your rules once: shifts, grace time, late-mark penalty, half days, holidays and leave policy.
- The software applies the rules automatically to every punch, marking late, half day, absent and overtime without anyone typing a code.
- Exceptions are handled in the app. If someone forgot to punch, they raise a request and the manager approves it.
- You pick a report and a date range, such as monthly attendance for October or overtime for one team, and it’s ready in seconds.
- You export it as Excel or PDF, or send it straight to payroll.
Everything we did for Ramesh by hand happens in the background, for every employee, every day. No dropdowns to set up, no formulas to break and no arguments about who changed what.
Mistakes That Ruin Attendance Reports

- Starting without written rules. Every number becomes a debate.
- Mixing codes. “P”, “Present” and “p” in the same sheet will break your formulas.
- Marking Sundays and holidays as absent. This quietly cuts people’s pay and causes complaints.
- Mixing paid and unpaid leave. Keep them as separate codes, because they affect salary differently.
- Skipping the “days add up” check. It’s the fastest way to catch a missing entry.
- Fixing records without approval. Every change should have a reason and a name behind it.
- Doing it all on the last day. Update attendance daily or weekly, so month-end is quick.
- Sending reports on group chats. Attendance data is personal, so share it only with HR, payroll and the employee’s own manager.
That last point matters more now. Under India’s Digital Personal Data Protection (DPDP) Act, 2023, employee data such as attendance, leave and location must be kept secure and used only for employment purposes. Most duties under the Act become enforceable on 13 May 2027, so it’s worth building good habits now. This is general information, not legal advice.
Final Thoughts
Remember the month-end scene from the start: stained registers, WhatsApp leave requests and three unhappy employees? Look at Ramesh’s report now. Every number, from his present days to his payable days, has a clear rule behind it. If he asks why his salary was lower this month, the answer takes thirty seconds to explain.
That’s what a good attendance report gives you: not just numbers, but clarity and trust. Start with written rules, use simple codes and let the sheet do the counting. When your team grows beyond what a spreadsheet can comfortably handle, let software take over, so you can spend month-end on your business instead of on a register.
Create Attendance Reports Automatically with Attendi
Attendi is a simple attendance management system built for Indian businesses. It records attendance through biometric and QR code methods, manages leave and holidays, tracks working hours for payroll and creates clear, accurate reports in one place, with no formulas to set up. If you’re tired of building attendance reports by hand every month, Attendi can do it for you. Explore more guides on our website or get in touch through our contact page.
Frequently Asked Questions
How do I create a monthly attendance report in Excel?
List employees in rows and dates in columns. Enter a short code for each day, such as P for present, A for absent and L for leave. Use the COUNTIF formula to count each code, add a dropdown list to avoid typing mistakes, and use colours to highlight absences and late marks.
How is attendance percentage worked out?
It shows how many working days an employee actually came in, out of the days they were expected to work. Sundays, weekly offs and holidays are left out, and a half day counts as half.
How are payable days calculated?
Payable days usually include present days, paid leave, weekly offs and paid holidays, with a half day counted as half. Absences, unpaid leave and any late-mark penalties are not paid, based on your company’s rules.
What should an attendance report include?
Employee ID, name, department, days present, half days, absences, paid and unpaid leave, weekly offs, holidays, late marks, overtime hours, attendance percentage and payable days.
What is a muster roll?
A muster roll is the monthly, day-by-day attendance record of all employees. It’s a type of attendance report and is commonly kept to meet labour law record-keeping requirements in India.
Is attendance software better than Excel for reports?
For a small team, Excel works fine. For larger teams, shift work, multiple locations or remote staff, attendance software is faster and more accurate, because reports are created automatically from time-stamped punches.