
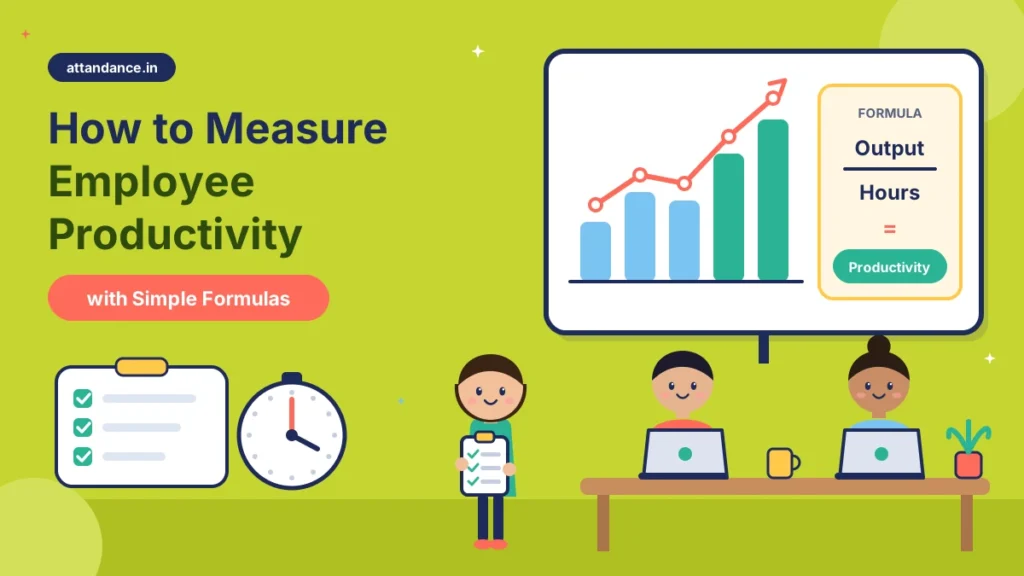
Two employees both spend nine hours in the office. One finishes three important tasks; the other spends most of the day on calls that go nowhere. On an attendance register, they look exactly the same. That gap is the reason businesses want to learn how to measure employee productivity, instead of guessing who is doing well based on who stays late.
The good news is that you do not need expensive software or a data team to begin. A few simple formulas, built on numbers you already have, can show you where work is moving and where it is getting stuck. Most of those numbers come from records you already keep, such as attendance, working hours, and completed work. If you are still setting those up, our attendance management guides explain the basics.
This guide covers what productivity really means, five easy formulas with worked examples, which formula suits which role, and the mistakes that make productivity numbers unfair.
What Employee Productivity Really Means
At its core, productivity is the relationship between what goes in and what comes out. Economists use the same idea at a national level. The US Bureau of Labor Statistics defines labor productivity as real output per labor hour.
For a business, the input is usually time, measured in hours or days worked. The output depends on the job. It could be orders packed, calls resolved, sales closed, or tasks completed. A productive employee is not the one who works the longest hours. It is the one who produces good results from the time available.
This is why you should always measure productivity against a clear output. If you cannot say what a role is expected to deliver, no formula will give you a useful answer.
5 Simple Formulas to Measure Employee Productivity
Each formula below answers a different question. You do not need all five. Pick the ones that match the work your team does.
Output per Hour
This is the most direct way to measure productivity, and it works best when the output can be counted.
Formula: Output ÷ Hours worked
Example: A warehouse packing team packs 1,200 orders in a month and works a total of 160 hours. Their productivity is 1,200 ÷ 160 = 7.5 orders per hour. Next month, if they pack 1,350 orders in the same 160 hours, productivity rises to about 8.4 orders per hour.
Use this for roles with clear, repeatable output, such as production, packing, data entry, or delivery.
Task Completion Rate
Many office roles do not produce a single countable unit. For them, the share of assigned work that actually gets done is a better measure.
Formula: (Tasks completed ÷ Tasks assigned) × 100
Example: A marketing executive is assigned 45 tasks in a month and completes 38. The task completion rate is (38 ÷ 45) × 100 = 84.4%.
This formula is only fair when tasks are of similar size. Finishing one large campaign is not the same as finishing one small social media post, so group or weight tasks if their size varies a lot.
Revenue per Employee
This is a company-level view. It shows how much revenue the business earns for every person on the team.
Formula: Total revenue ÷ Number of employees
Example: A business with 15 employees earns ₹1,20,00,000 in a year. Revenue per employee is ₹1,20,00,000 ÷ 15 = ₹8,00,000.
Use this to track overall trends year on year, or to see whether new hiring is adding value. It is not useful for judging one individual, because revenue depends on many people and outside factors.
Attendance Rate
An employee cannot be productive on days they are not at work. The attendance rate shows how much of the planned working time was actually available.
Formula: (Days present ÷ Total working days) × 100
Example: In a month with 26 working days, an employee is present for 23 days. The attendance rate is (23 ÷ 26) × 100 = 88.5%. The flip side, the absenteeism rate, is (3 ÷ 26) × 100 = 11.5%.
Count only unplanned absences as absenteeism. Approved leave is part of an employee’s rights, so it should not lower anyone’s score. Our guide on the types of leave employees get in India explains which leaves are usually planned and paid.
Utilization Rate
Being present is not the same as being busy with useful work. The utilization rate shows how much of the available time went into productive work.
Formula: (Productive hours ÷ Total available hours) × 100
Example: A designer has 176 available hours in a month and logs 140 hours on client projects. The utilization rate is (140 ÷ 176) × 100 = 79.5%.
A rate close to 100% is not the goal. People need time for meetings, learning, and short breaks. A steady rate in the 70% to 85% range is often healthier than one pushed to the limit. To get these numbers right, you need accurate records of working hours and overtime.
Add a Quality Check to Every Formula
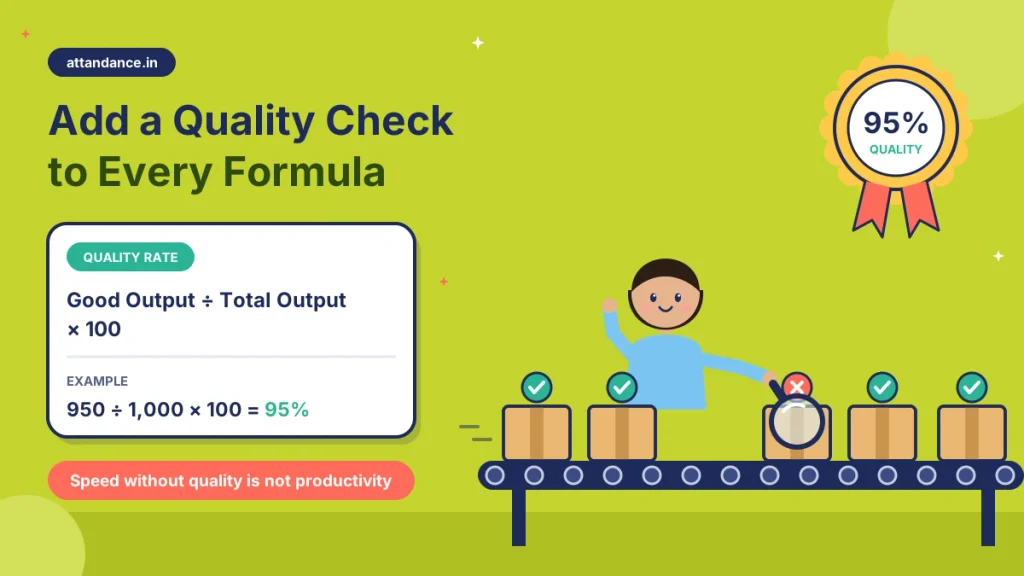
Speed without quality is not productivity. A packer who packs 10 orders an hour with five wrong items is not more productive than one who packs 8 correctly.
Formula: (Good output ÷ Total output) × 100
Example: If an employee completes 1,000 entries and 950 are error-free, the quality rate is 95%.
Read every productivity number alongside a quality number. If output goes up while quality drops, the team is rushing, not improving.
Which Formula Fits Which Role
| Type of role | Best formula to start with | Also track |
|---|---|---|
| Production, packing, delivery | Output per hour | Quality rate |
| Sales | Revenue or deals per employee | Attendance rate |
| Office and project roles | Task completion rate | Utilization rate |
| Customer support | Tickets resolved per hour | Quality rate |
| Field staff | Visits completed per day | Attendance rate |
| Whole company | Revenue per employee | Absenteeism trend |
There is no single right answer to how to measure employee productivity, because the best formula always depends on the role.
How to Start Measuring in Your Team
Begin by deciding what good output looks like for each role, and write it down in plain words. Share it with employees before you start measuring, so nobody feels judged by a rule they did not know about.
Next, collect a month of clean data. Attendance, working hours, and completed work should come from records, not from memory. Once you have the first month, treat it as your baseline. Productivity is most useful as a trend, so compare each month with that baseline rather than with an ideal number.
Finally, review the numbers with the team, not just about them. A sudden drop often has a simple reason, such as a broken machine, a new process or a colleague on long leave. Talking about it turns a number into a fix.
Mistakes That Make Productivity Numbers Misleading
The most common mistake is using hours as a stand-in for output. Long hours can hide slow work, and short hours can hide excellent work. Hours tell you about input, never about results.
Another mistake is comparing people in different roles with the same formula. A support agent and a designer will never have comparable task counts. Compare people only with others in the same role or with their own past numbers.
The third mistake is forgetting context. Festival season, a new joiner still learning, or a month with several public holidays can all change the numbers. Look at the reason before reacting to a dip.
Before vs Now
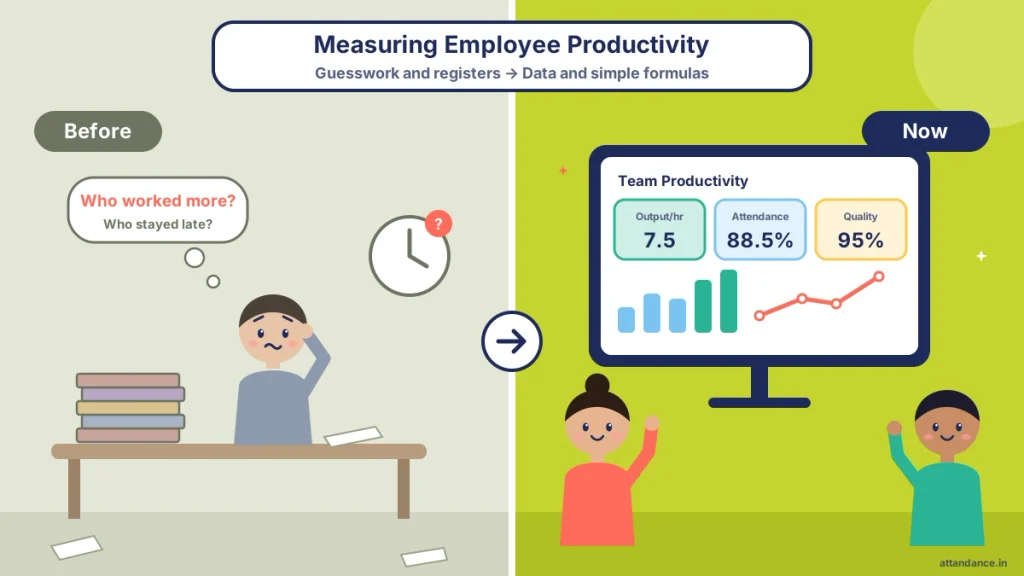
| Task | Before (Guesswork and Registers) | Now (Data and Simple Formulas) |
|---|---|---|
| Judging performance | Based on who stays late | Based on output per hour and quality |
| Attendance data | Paper register checked at month end | Daily records ready for the attendance rate |
| Working hours | Rough estimates | Logged hours for the utilisation rate |
| Comparing months | Feeling that “this month was slow” | Clear trend against a baseline |
| Absences | Approved and unplanned leave mixed together | Unplanned absences tracked separately |
| Team reviews | Opinions and arguments | Shared numbers and practical fixes |
FAQs
What is the simplest way to measure employee productivity?
Divide output by hours worked. For example, 1,200 orders packed in 160 hours gives 7.5 orders per hour.
How do you measure productivity for office employees?
Use the task completion rate along with the utilization rate. Make sure tasks are of similar size, or group them by size.
Is attendance a good measure of productivity?
On its own, no. Attendance shows how much time was available, not what was done with it. It works best as a supporting number next to an output-based formula.
How often should productivity be measured?
Monthly reviews work well for most small businesses. Weekly checks can help in fast-moving roles such as sales or packing.
Can productivity tracking hurt employee trust?
It can, if it feels like surveillance. Share the goals in advance, measure results rather than every minute, and review the numbers together with the team.
Final Thoughts
Learning how to measure employee productivity comes down to a few simple ratios: output per hour, task completion rate, revenue per employee, attendance rate, and utilization rate, each read with a quality check. Choose the formula that fits each role, build a baseline from clean data, and use the trend to start conversations, not to blame people.
The hardest part for most businesses is getting reliable attendance and working-hours data in the first place. Attendi records attendance, working hours, and leave in one app and turns them into reports, so the numbers behind these formulas are ready every month without spreadsheet work.